Ever wondered how successful NDIS providers stay ahead of compliance requirements while growing their business? The answer lies in data. Advanced NDIS software analytics and reporting capabilities transform raw participant information into actionable business intelligence that drives smarter decisions.
According to research by McKinsey & Company, organisations that leverage data-driven decision making are 23 times more likely to acquire customers and 19 times more likely to be profitable.
NDIS providers handle massive amounts of data daily. Participant plans, support worker shifts, incident reports, and financial transactions create a complex web of information. Without proper analytics tools, this data remains scattered across spreadsheets and filing cabinets.
Are you making critical business decisions based on gut feeling rather than solid data? You’re not alone. Many NDIS providers struggle with fragmented reporting systems that make it impossible to see the complete picture.
Essential NDIS Reports: Your Business Intelligence Foundation
Modern NDIS providers need access to seven key report categories to maintain competitive advantage and regulatory compliance.
Financial Performance Reports
Financial analytics form the backbone of successful NDIS operations. These reports track revenue streams, claim processing times, and budget utilisation across all participants.
Your NDIS reporting software should automatically generate profit and loss statements by service category. This shows which supports generate the highest margins and where costs exceed budgets.
Monthly cash flow reports identify payment delays from the NDIA. Some providers wait 30-45 days for claim approvals, creating cash flow challenges that proper analytics can predict and prevent. Learn more about efficient NDIS invoicing processes that reduce payment delays.
Participant Outcome Tracking
Quality indicators demonstrate the real impact of your services. Goal achievement rates, support plan utilisation, and participant satisfaction scores tell the story of your organisation’s effectiveness.
Advanced NDIS data analysis tracks progress notes and incident patterns to identify participants who might need additional support. Early intervention prevents crises and improves outcomes.
Support coordination effectiveness becomes visible through analytics. You can see which coordinators achieve the best participant outcomes and replicate their successful approaches across your team. For more insights on efficient support coordination, explore specialised tracking tools.
Operational Efficiency Metrics
Staff productivity reports show actual versus scheduled hours, travel time efficiency, and no-show rates. This data reveals hidden inefficiencies that eat into profit margins.
Roster optimisation analytics identify gaps in service delivery before they affect participants. Smart scheduling reduces travel costs while ensuring adequate coverage across all service locations. Discover how advanced NDIS rostering enhances both efficiency and compliance.
Equipment and resource utilisation reports track asset usage across multiple participants. This prevents over-ordering supplies while ensuring adequate stock levels for quality service delivery.
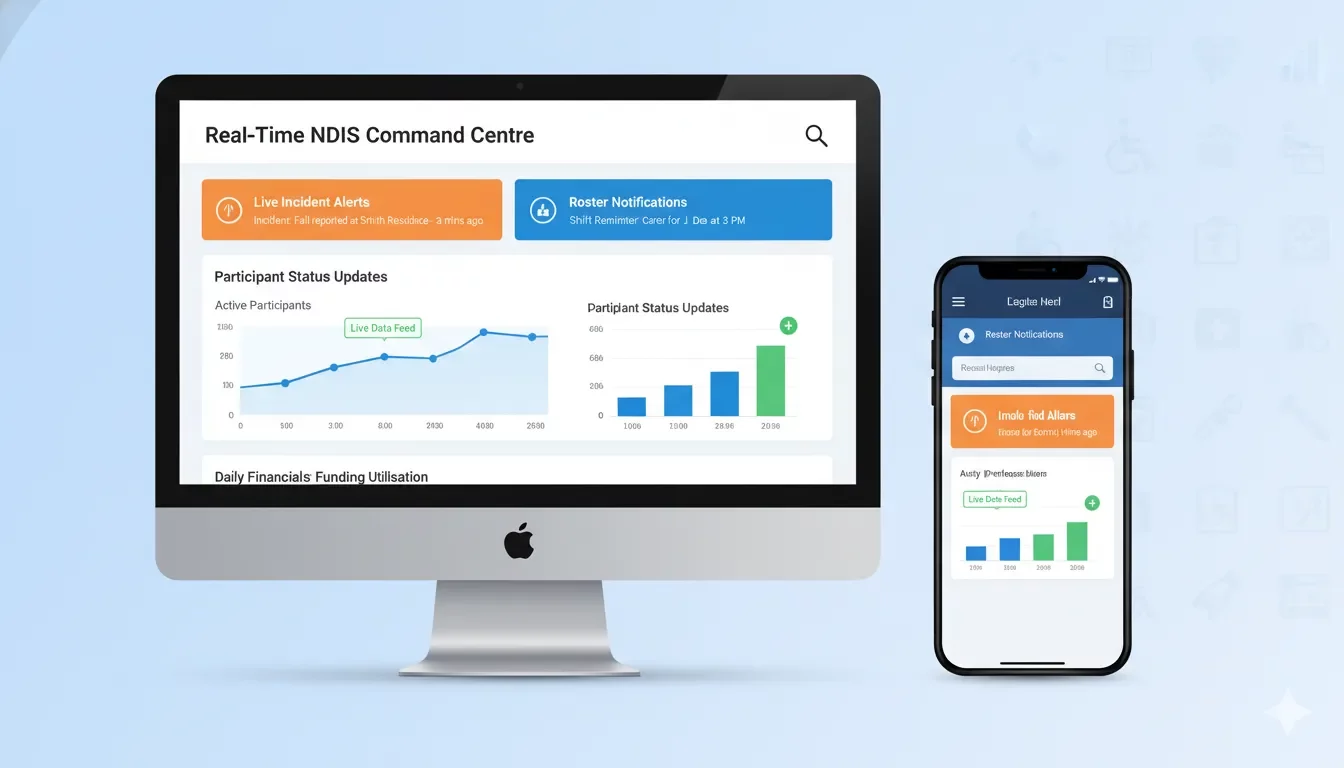
Real-Time Dashboards: Live Data for Instant Insights
Static monthly reports tell you what happened last month. Real-time dashboards show you what’s happening right now, enabling immediate action when issues arise.
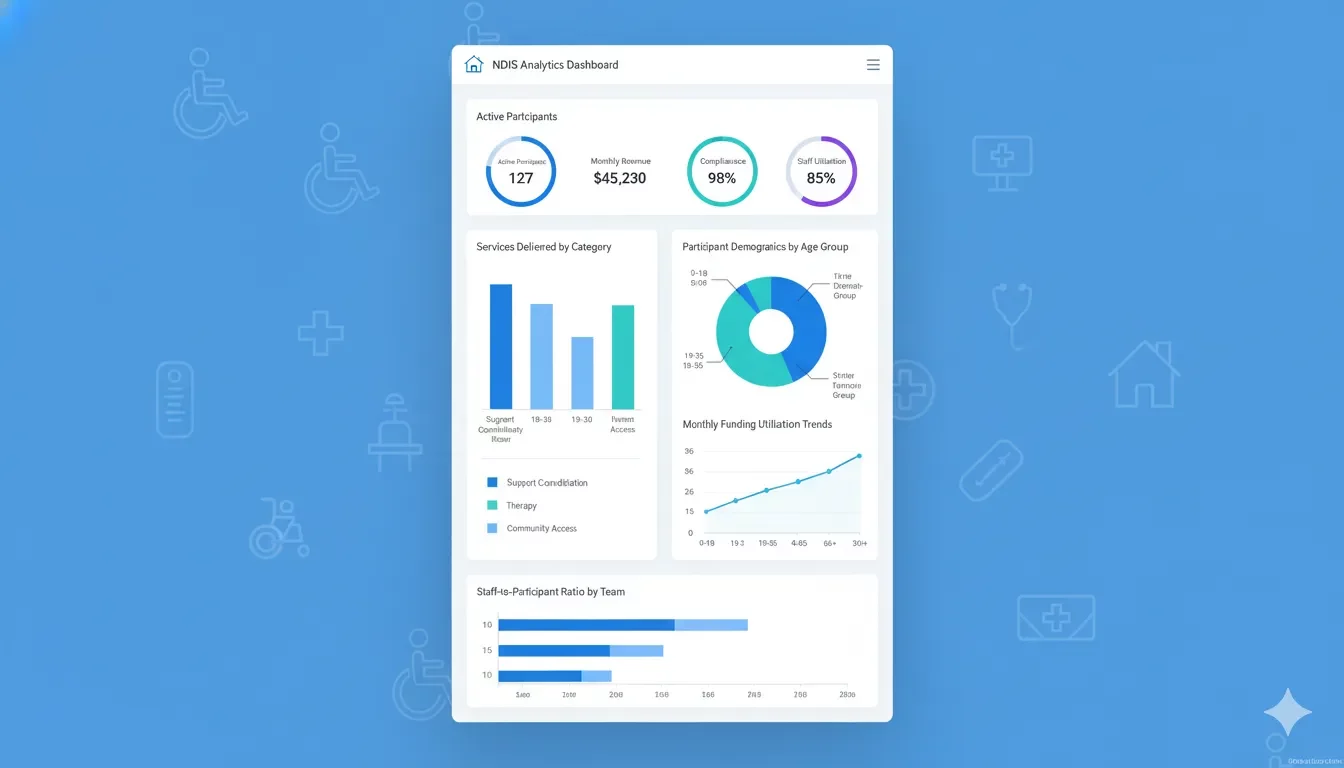
Executive Dashboard Features
Your dashboard should display key performance indicators at a glance. Revenue targets, active participants, outstanding claims, and staff utilisation rates provide instant business health checks.
Alert systems notify managers immediately when critical thresholds are reached. Low participant plan balances, approaching service deadlines, and staff shortage warnings prevent service disruptions.
Geographic heat maps show service density across your operational area. This visualisation helps identify expansion opportunities and resource allocation gaps.
Operations Dashboard Elements
Support workers benefit from mobile-friendly dashboards showing their daily schedules, participant notes, and task completion status. This reduces administrative overhead while improving service quality.
Supervisor dashboards aggregate team performance metrics. Completed visits, documentation compliance rates, and participant feedback scores enable effective team management.
Compliance monitoring displays audit readiness indicators. Document expiry dates, training requirements, and incident follow-up status keep your organisation audit-ready at all times.
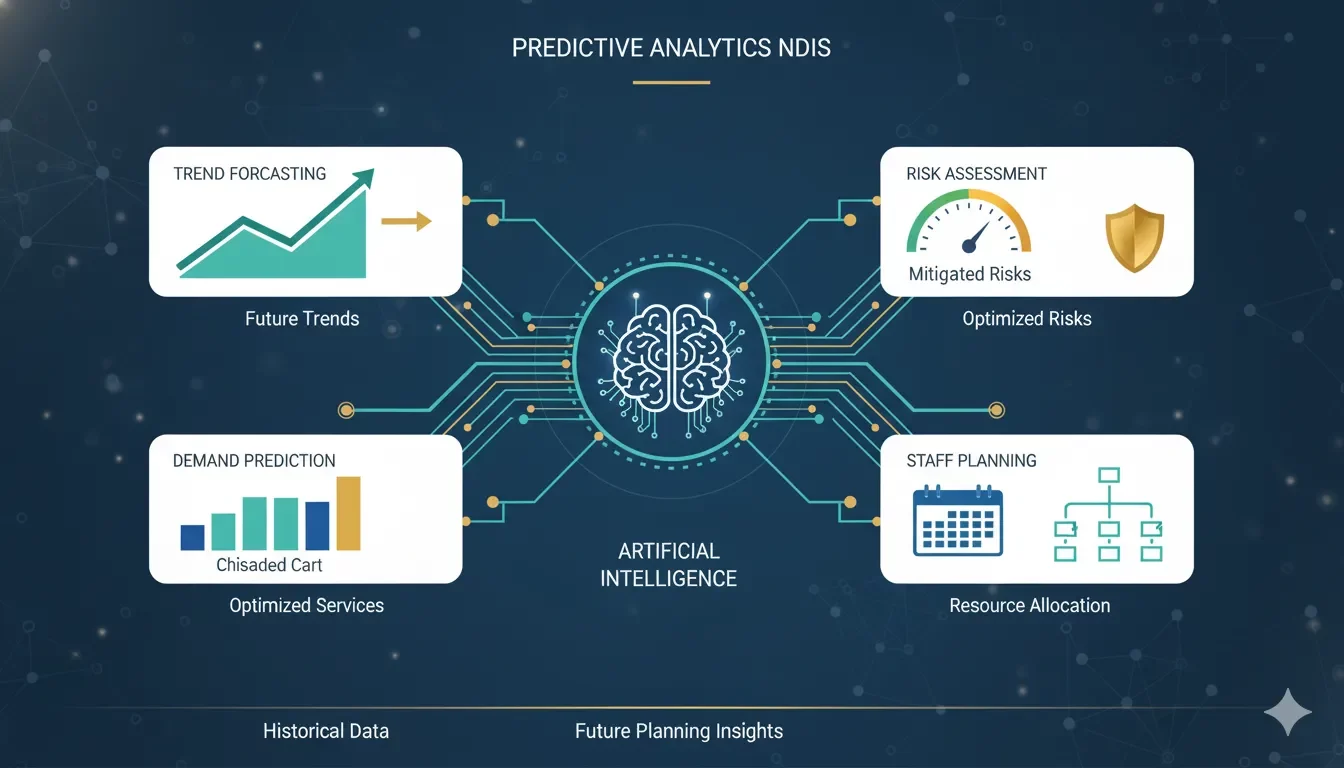
Predictive Analytics: Future Planning Through Data Intelligence
Historical data patterns reveal future trends when analysed correctly. Predictive analytics help NDIS providers anticipate challenges and capitalise on opportunities. According to Harvard Business Review, organisations that successfully implement predictive analytics see 73% improvement in customer satisfaction and 70% improvement in operational efficiency.
Demand Forecasting
Service demand patterns emerge from historical booking data. Seasonal variations, participant lifecycle stages, and support intensity changes become predictable with sufficient data analysis.
Staffing requirements can be forecasted based on participant growth trends and service complexity changes. This prevents under-staffing during busy periods while avoiding unnecessary labour costs.
Equipment and supply needs become predictable through usage pattern analysis. Automatic reordering based on consumption forecasts ensures service continuity without excess inventory costs.
Risk Management Strategies
Incident prediction models identify high-risk situations before they occur. Participant behaviour patterns, environmental factors, and staff experience levels combine to create risk probability scores. Learn about comprehensive incident management strategies for proactive risk mitigation.
Financial risk assessment tracks payment delays, plan underspending, and service cost escalations. Early warning systems help providers adjust operations before problems become critical.
Staff turnover predictions identify team members at risk of leaving. Proactive retention strategies based on engagement metrics and workload analysis reduce costly recruitment cycles.
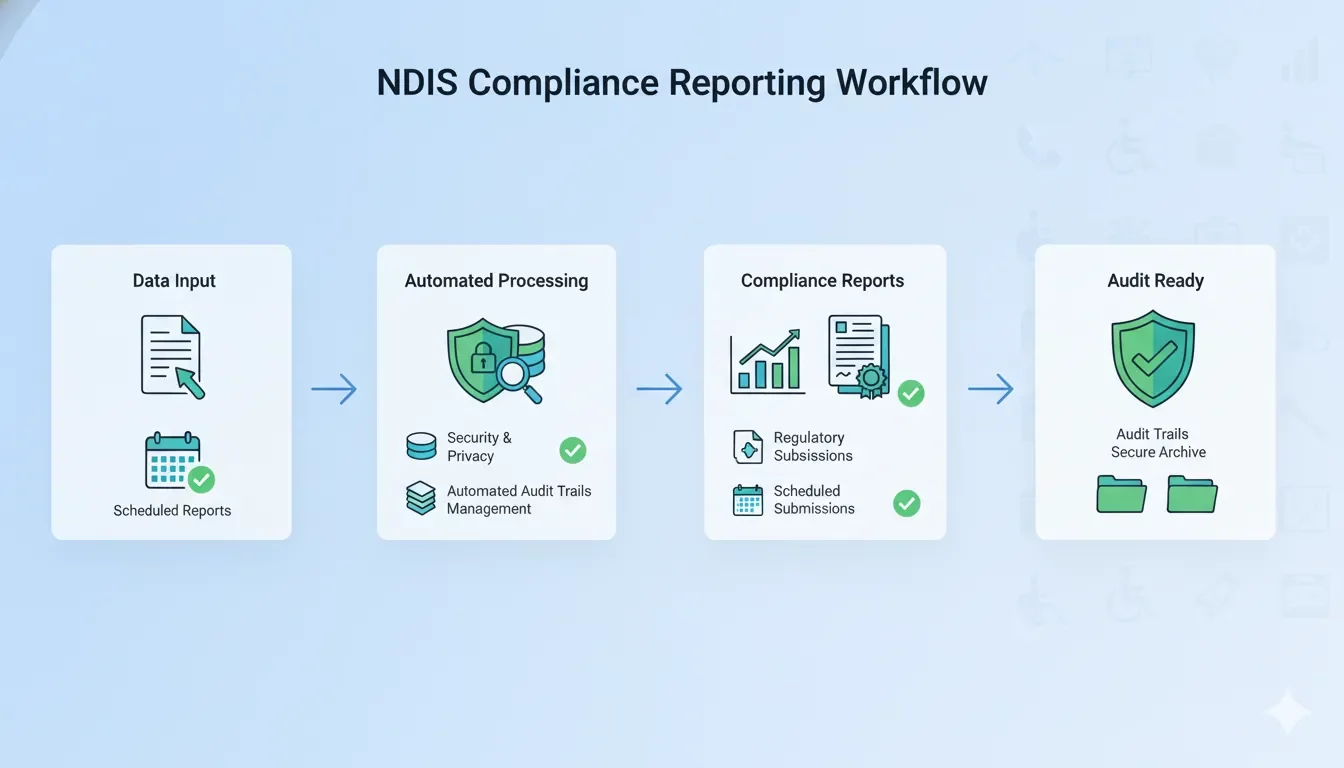
Compliance Reporting: Automated Documentation for Audit Readiness
NDIS compliance requirements demand extensive documentation and regular reporting. Automated compliance systems reduce administrative burden while ensuring nothing falls through the cracks.
Audit Trail Maintenance
Every action within your NDIS software creates an automatic audit trail. User logins, data changes, and document access create comprehensive records for regulatory review.
Document version control tracks all changes to participant plans, policies, and procedures. This ensures auditors can see the evolution of your compliance framework over time.
Access logs demonstrate proper data security practices. WHO accessed WHAT information WHEN becomes instantly available for privacy impact assessments and breach investigations.
Regulatory Report Generation
Monthly quality indicator reports compile automatically from operational data. This saves hours of manual data collection while ensuring accuracy and consistency. The NDIS Quality and Safeguards Commission requires regular quality indicator reporting to demonstrate continuous improvement.
Incident trend analysis helps identify systemic issues requiring policy updates. Pattern recognition across multiple incidents reveals training needs and process improvements. Explore detailed incident management software capabilities for enhanced compliance tracking.
Financial compliance reports track claim accuracy and support plan adherence. Automatic variance alerts prevent overspending and billing errors before they reach the NDIA.
Vertex360 Analytics Tools: Built-in Business Intelligence
Vertex360’s analytics capabilities provide comprehensive business intelligence without requiring separate reporting tools or expensive add-ons.
Integrated Dashboard Features
The provider dashboard consolidates key metrics across all operational areas. Financial summaries, participant overviews, and staff schedules appear in one unified view.
Real-time notifications keep managers informed of critical events. Late arrivals, incident reports, and plan balance alerts ensure immediate response to developing situations.
Mobile-responsive design ensures dashboard access from any device. Field supervisors can monitor operations and make decisions without returning to the office.
Comprehensive Reporting Suite
Built-in report generators create professional outputs for stakeholders, auditors, and funding bodies. Custom date ranges, participant filters, and service categories provide targeted insights.
Export capabilities allow data transfer to accounting systems and external analysis tools. CSV, PDF, and Excel formats ensure compatibility with existing business processes.
Scheduled reporting automatically delivers key reports to relevant team members. Monthly summaries, weekly updates, and daily operational reports arrive without manual intervention.
Cost-Effective Analytics
Both Total Suite ($31.50/month) and Platinum ($54/month) plans include comprehensive analytics capabilities. This eliminates the need for expensive third-party business intelligence tools.
No per-user fees for dashboard access means entire teams can benefit from data insights without escalating software costs. Support workers, supervisors, and executives access relevant information at no additional charge.
Training and support ensure teams maximise analytical capabilities. Vertex360’s customer support helps organisations implement effective reporting frameworks tailored to their specific needs.
Data-Driven Decision Making: Framework for Business Excellence
Converting analytics into action requires structured decision-making frameworks that translate data insights into operational improvements.
Performance Optimisation Process
Monthly performance reviews should examine key metrics against established benchmarks. Identify areas performing above and below expectations, then investigate underlying causes.
Root cause analysis uses drill-down capabilities to understand WHY metrics vary from targets. Surface-level numbers rarely tell the complete story behind performance variations.
Action plan development translates insights into specific improvement initiatives. Assign responsibilities, set timelines, and establish success measures for each improvement project.
Strategic Planning Integration
Annual business planning incorporates historical performance data and predictive analytics. Set realistic growth targets based on actual capacity and market demand patterns.
Resource allocation decisions benefit from utilisation analytics and demand forecasting. Invest in areas showing growth potential while optimising underperforming operations.
Market expansion strategies use geographic and demographic analytics to identify optimal locations and target participant populations.
Continuous Improvement Culture
Regular team meetings should review performance dashboards and discuss improvement opportunities. Make data analysis a routine part of operational management.
Staff training programs can address performance gaps identified through analytics. Target education efforts where data shows the greatest impact potential.
Process refinements based on efficiency metrics create compound improvements over time. Small optimisations accumulated across multiple operations generate significant results.
Maximising Your Analytics Investment
Implementing business intelligence requires more than selecting software—it demands organisational commitment to data-driven decision making.
Start with clear objectives for your analytics implementation. Define specific questions you want answered and metrics that indicate progress toward organisational goals.
Ensure data quality through consistent input procedures and regular validation processes. Accurate analytics depend on reliable source data across all operational areas.
Train teams on report interpretation and action planning. Raw data becomes valuable only when people understand how to convert insights into operational improvements.
Ready to transform your NDIS operations through advanced analytics and reporting? Vertex360‘s comprehensive business intelligence tools provide the insights needed for confident decision making and sustainable growth.
Start your journey toward data-driven excellence with a free 7-day trial of Vertex360’s analytics capabilities today.